
Benchmark Overview
This is part of our work done for our client ThingSphere.
We hustle to innovate beyond barriers for a connected, digital world powered by IoT.
We frequently come across vendors and solution providers who have difficulty scaling their products beyond a limit. However, we believe, with IoT based systems – any kind of finite limit for a product hinders the kind of problems that the platform can solve.
This benchmark of ThingSphere is aimed towards technologists to imagine what is possible when you have the ThingSphere stack in your infrastructure.
A lot of how-to’s and articles out there mentions breaching the million mark – but surprisingly, most of them let us down since they only mentioned achieving a number of concurrent maintained connections, without performing any significant data transfer.
We will now mention the steps we followed to achieve the desired scalability. In the process we put limits of each of the components to test – load balance, the TCP/IP protocol itself, the linux kernel networking stack, our message brokers – only to discover that ThingSphere, in collaboration with Solace can scale to numbers much larger than a million devices. The more detailed process of each step will be clearly explained as we go further in this blog post.


The benchmark process:
- To setup Tsung controller and nodes that would generate client connections and publishes messages to load balancer.
- To set up 6 solace software message brokers each capable of handling 200k concurrent connected devices.
- To implement a load balancer that sits in front of the message brokers and configure it to publish the messages received by the Tsung clients to the message brokers.
- Then we can start the test in Tsung Controller for about 1300 to 1400 seconds to get the final results.
Overview of Challenges
Challenges
Issues with Step 1:
- We had to deploy around 18 to 24 clients to generate a traffic greater than 1 million concurrent connections to our platform.
Issues with Step 2:
- Before running the test it is important to make sure that all the default message brokers configurations need to set to there respective maximum values.
Issues with Step 3:
- We have seen that our load balancer is showing some error saying that sticky wouldn’t work proper with multiprocessor environment.
Challenges with Cloud Providers
Issues with Digital Ocean:
- Our infrastructure was initially deployed in digital ocean but when we conducted our initial test we could see port exhaustion problem within the load balancer and there is no further connections possible from load balancer to message brokers
- To avoid this port exhaustion problem we need to create virtual IP’s that could give us more number of (Source IP + Source Port) combinations. But currently, DigitalOcean do not support creating a VPC to create virtual client IP’s
- So we have to move our setup to AWS
Issues with AWS:
- AWS works fine and provide us with VPC to work with virtual IP for clients but somehow the EC2 instances is limiting the number of TCP connections.
- We had to try many EC2 instance type but couldn’t get more than 1.4 million concurrent TCP connections approximately.
- Finally we had to use EC2 instance with a higher throughput to get more than 2 million connections on our LB i.e., >1 million outbound connections to brokers and >1 million inbound connections from the Tsung clients.
This is just an overview of the challenges we faced while conducting our tests. A more detailed view of this challenges and how we come up with solutions to this problems will be specified in detail as we go further in this blog series.
Architecture Overview
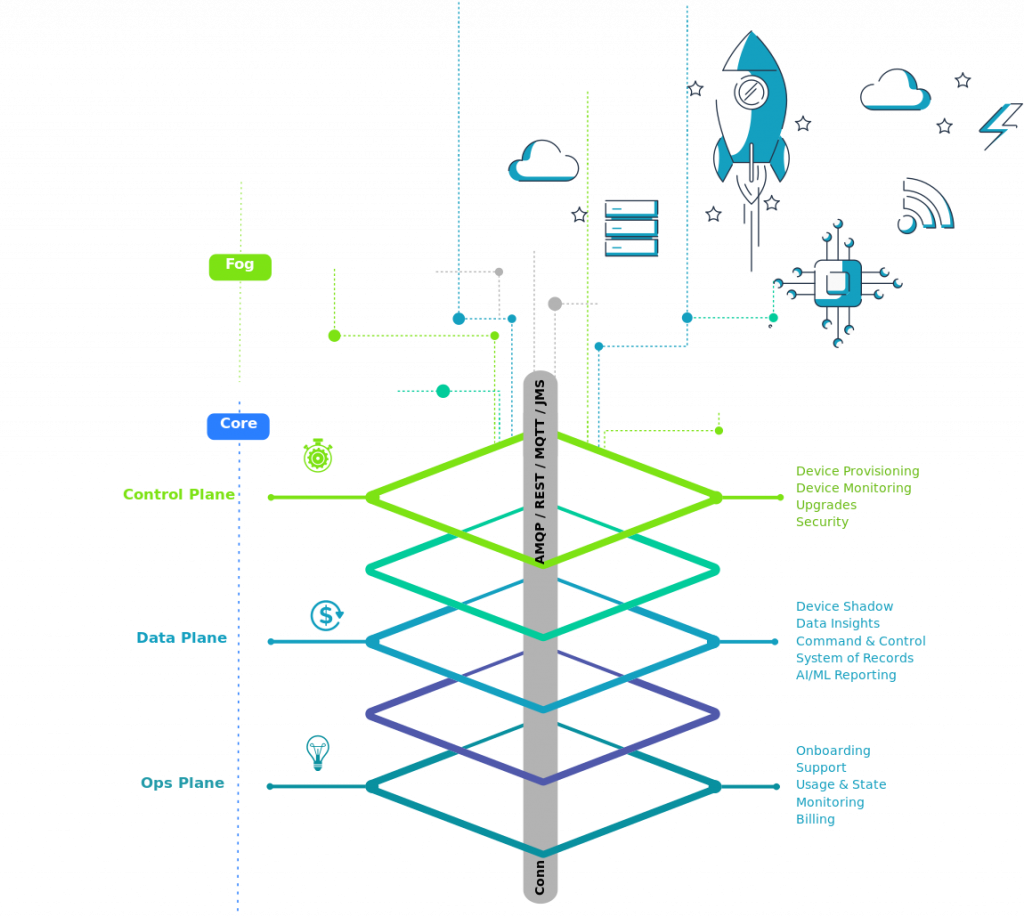
Control Plane
Control Plane is the core of the architecture. All the IoT device related operations are handled in this layer. This layer is responsible for Device Management which includes Registering the device to the platform, Provisioning it, Ensuring device security, Timely updates of the device’s firmware.
Data Plane
IoT projects always concerned about data handling. As per our architecture all the data related operations will be carried in the data plane. The major computation on data like analysing it, deriving results and providing insights will be handled in this layer. Apart from data analysis the other features which highly depends on historical data like Device Shadow will be taken care in this plane.
Ops Plane
This layer majorly focuses the business point of view. This layer will be responsible for keeping an eye on numbers. Here we closely monitor the number of devices our platform is serving and takes the responsibility of providing a proper support system for any platform issues in post production deployment. We would here clearly mention the usage and working state of the platform and would provide the billing details to the business users.
Fog Layer
Fog layer is where all our IoT devices that are to be connected to the platform are located. In this layer we may also do fog computing based on architecture size and as per user requirements. Fog computing may address the initial data cleaning, protocol conversion if needed in the edge gateway before the data is being sent to cloud.
a) Typical messaging architecture options
- Different brokers
- Usually people go with different message brokers like Mosquitto, HiveMq initially we even worked with some before choosing solace as our message broker. Many failed to give huge concurrent client connections even with High RAM and CPU.
- Unlike solace Apache kafka Cannot achieve fine-grain authorization, so filtering must be handled by the application. Fine grain filtering in the application increases load on applications, offers a weak fan-out support in broker. Moreover Kafka is limited saying that transactions can only exist within a cluster.
- Persistent messages
- All brokers usually doesn’t support persistent messaging. Persistence is a property of a an individual message. The main difference is that if you are using persistent delivery, messages are persisted to disk/database so that they will survive a broker restart. Solace can be implemented with persistent messaging mechanism.
- Queue implementation
- When we are working IoT applications connectivity is one of the issue. We can’t expect proper connection between brokers and our servers all the time. So we must need a queue that stores the messages during connectivity loss. With many brokers we need to implement the queue manually.
- But with solace the broker itself configured with its inbuilt queue that varies from a size of 0- 6000000 MB. So that we can re can recover the queued messages after establishing the connection.
- Non-broker architecture
- There are IoT implementations where people implemented non broker communication with point-to-point messaging. Point to Point (P2P or PTP) is built on the concept of message queues with publisher addressing messages to specific Queue and the receiving clients extracting messages from the queue. The Queue acts as a holding area and messages are retained in the Queue until they are consumed or expire.
- Queues remove the timing dependency between senders and receivers. As the name Point-to-Point implies, each message can be consumed by only one consumer, though multiple consumers can bind to a queue.
- Moreover, as the architecture grow the implementation become complex and performance will be degraded.
b) Designing our communication architecture
From our study and comparative analysis of various components we decided to use Tsung as our benchmarking tool, Solace as our message broker a load balancer. Our communication flow for benchmarking our platform will be like this:
- Tsung benchmarking tool generates MQTT data as per requirements and configurations we gave it in XML file.
- The messages generated from Tsung nodes will be published to our load balancer.
- In our Load Balancer we would redirecting the messages to message brokers which is to be specified in it’s configuration file.
- Using persistent sticky rules in our Load Balancer, the client would stick to one server only at any point of time. Hence the device would also look into the same broker.
- All the required calculations and statistics will be done in Tsung controller node and the results will be given in WebUI at port 8091.
- And the clients can subscribe to the load balancer as the DMR is enabled on all message brokers and made them into a cluster the client would reach out to any message broker the message can be subscribed from any broker.
c) How we use Solace
We deployed solace software message broker as the messaging backbone for our stack. From vertical scaling we achieved 200k concurrent connections with one message broker and this is the maximum limit we can get from single software message broker. To achieve greater than one million concurrent connections we deployed 6 message brokers each can handle 200k simultaneous connections. These brokers are again interconnected using DMR. This enables us to assure that our platform has a capability to handle greater than 1 million concurrent connections. And all this message brokers are connected to a load balancer to which our IoT devices will be publishing data. The load balancer in turn publishes this data to the message brokers.
When coming to the subscribing to a topic, we will be implementing DMR (Dynamic Message Routing) to scale the capabilities of individual message broker.In this configuration a single cluster is created to connect all the 6 message brokers and an internal link is configured between each node, which supports dynamic subscription learning and both direct and guaranteed message delivery modes. Together, the six nodes increase the connection limits, subscription limits, queue limits, and bandwidth beyond a single node, without adding additional subscription management. So when a device need to subscribe to a topic it can subscribe to the load balancer similar to the publishing messages. The load balancer can land the subscribe request to any of the message broker and get the messages from it.
Benchmark Methodology
a) Options at hand
- We tested sending data with tools like mqtt-bench, sdkperf, Tsung as per our analysis the rest of tools other than Tsung are command line applications just give limited end results.
- But Tsung give stats and graphs with WebUI. And also Tsung usually seem to be generating the clients in real time perspective. So we used Tsung so that viewers can easily understand the stats and graphs.
b) Tsung – Distributed load test
We used Tsung an open source lightweight tool version 1.7 to generate MQTT messages to our brokers. Tsung probably works with distributed clients like master slave concept. There will be a Tsung controller on which the tsung runs can be compared as master. And tsung needs clients that publishes mqtt message to server. And to generate more than million clients, as per calculations we have taken 24 clients each maintains around 64k connections so (24*64000 = 1536000) i.e., 24 clients can generate more than 1 million connections.
c) Configuring Tsung and challenges
Tsung is written in erlang and in distributed test environment erlang and tsung is needed to be installed in the controller and all tsung nodes to run test. In order to make all clients work tsung and erlang of same versions which is (tsung1.7 and erlV10.1) in our case to be installed in them. Tsung nodes communicate with controller by ssh. So we need to add controller’s public key to all tsung clients. Now nodes are set and we can configure the the controller to use this clients and publish the MQTT messages with the help of XML file.Each message is published with QOS 1 which ensures that message is published without fail.
The tsung.xml file is used to configure the Tsung controller how the messages are to be published:
<?xml version=”1.0″?>
<!DOCTYPE tsung SYSTEM “/usr/share/tsung/tsung-1.0.dtd”>
<tsung loglevel=”warning” version=”1.0″>
<clients>
<!–Mention as many clients as per requirement maxusers specify the number of connections each client can generate, cpu count determines how many cores the clients can use and weight specifies priority of clients –>
<client host=”206.189.129.224″ maxusers=”64000″ cpu=”4″ weight=”1″/>
<client host=”142.93.211.226″ maxusers=”64000″ cpu=”4″ weight=”1″/>
<client host=”139.59.47.55″ maxusers=”64000″ cpu=”4″ weight=”1″/>
</clients>
<servers>
<!–Specify the server to which we will be publishing the MQTT data –>
<server host=”13.127.84.130″ port=”1883″ type=”tcp”/>
</servers>
<load>
<!–We can specify the load to be given to load balancer. Here we are performing test in single phase for about 1200 sec and with arrival rate of 1000 connections per second —>
<arrivalphase phase=”1″ duration=”1200″ unit=”second”>
<users arrivalrate=”1000″ unit=”second”/>
<!–By the end of the test we would have (1000*1200 = 1.2Million) connectionections approximately –>
</arrivalphase>
</load>
<sessions>
<session name=”mqtt_publisher” probability=”100″ type=”ts_mqtt”>
<request>
<!–Allowing client to get connected with a keepalive time of 1000 sec –>
<mqtt type=”connect” clean_start=”true” keepalive=”1000″ will_topic=”will_topic” will_qos=”0″ will_msg=”will_msg” will_retain=”false”></mqtt>
</request>
<!–Each client publishes around 100 messages QOS 1 with in our case we can give any number here –>
<for from=”1″ to=”100″ incr=”1″ var=”loops”>
<request subst=”true”>
<mqtt type=”publish” topic=”test_topic” qos=”1″ retained=”true” stamped=”true”>test_message</mqtt>
</request>
</for>
<!–Add some thinktime to each session so that after completing the publishes the clients stay connected–>
<for var=”i” from=”1″ to=”3000″ incr=”1″>
<thinktime value=”10″/>
</for>
</session>
</sessions>
</tsung>
In xml file the clients portion show the tsung nodes and server is where to publish the mqtt messages. We mentioned to connect clients to server with arrival rate of 1000 for 1300 sec at the end we would get approximately (1000*1300 = 1300000) connections obviously greater than 1 million for sure. And to maintain the clients to not get disconnected after publishing the messages we have removed the disconnects part in tsung.xml file and also added think time of 30000 sec after the publish so that that keep the connection live even after publishing data and we would disconnect them manually. Now this will ensure all the clients that is 1 million clients maintains their connections even after ending the test duration. Now we can ensure that we can generate 1 million MQTT connections.
Before we run the test with tsung we had to make sure that the controllers, nodes and our load balancer to increase their ulimit and port range. In our case the ulimit is set as 10000000 and port range is 1024 to 65535. All the TCP related settings are described below.
We can run the test with the command “tsung -I <IP address of controller> -k -f tsung.xml”. And can view the results at “http://<IP address of controller>:8091”.
Parameters in test setup
Message size: We used the message sizes varying as 32 bytes, 44 bytes and 52 bytes. We tested for different message sizes and we have seen that there is no notable changes happened to the test result other than slight changes in throughput.
Message frequency: We specified that each client would publish around 100 messages after they get connected. The number of messages that client publishes do effect the MQTT published and puback count. As solace have a big queue support we observed that there is no issue of message drop.
Number of Queues and Topic endpoints: A number of topic endpoints effects the number of clients can publish and subscribe to the platform especially when the QOS is 1. The queue and topic endpoint in the message broker should set to its maximum to not to lose the connections.
Impact of QOS: Setting QOS to 1 or 0 won’t really change the test results as we increased the message broker settings like number of queues and topic to their maximum limit. But to ensure that our messages reach the broker and from broker to clients we specified the QOS as 1 during publishing to the message broker and subscribing from it.
Impact of adding more security features: Adding ssl security to the server in tsung.xml adds an extra computation overhead and things do change before and after adding ssl security to the server. But we chose a server that can easily handle this load and process the messages from clients seamlessly to the message brokers. Even with the ssl enabled on our server side we could reach out to million connections holding to our server from the clients.
d) Geography
We made sure that we could meet utmost real world perspective. In real world we can’t expect all the clients will be from same geographic location. So we also considered the same aspect and taken all our clients from different geographic locations so that we can generate near real time use case to give proper test results when our platform works in real world scenario.
e) Details about how the test replicated pub + sub as in a real world scenario
The test is carried in such a way that is pretty much close to real world scenario of client publishing messages to the load balancer which in turn connects to the message broker and publishes message to it. As sticky is enabled in our Load Balancer the client that connected to a message broker will be stickied to it until it gets disconnected from the platform. And also DMR will be enabled on the message brokers and all the message brokers will be clustered and that gives a cumulative subscription limit to the platform. And in the application if we need to subscribe to any topic we can now subscribe to load balancer that lands our request to any of the broker and can handle the subscribe request.
Components involved
a) Message Broker
- Initially we worked with Mosquitto message broker. The major drawback we find was number of concurrent connected devices. We have seen client closing errors just after few thousand concurrent connections sometimes – albeit with limited hardware resources. And also Mosquitto works only with MQTT. But we want to make our platform can be as customizable as possible we would want to provide support for most of IoT messaging protocols like (REST, JMS, AMQP, MQTT).
- And we found Solace PubSub+ meets our requirements. Moreover, we have seen from vertical scaling we can get 200k concurrent connections without connection loss or data loss. And also Solace supports many IoT protocols and can also magically converts the data in different protocols from different devices to our desired protocol type.
- We are working with solace docker images for solace enterprise version 9.0.0.17. Then we run the docker containers to setup the message brokers in all 6 servers each handles 200k concurrently connected devices. Before running the test we made sure that all the settings of solace message brokers are set to their maximum limits.
- Solace message brokers can configured with HA (high available). So that if any broker fails by chance the HA broker immediately takes its place and that will not impact the performance of our platform.
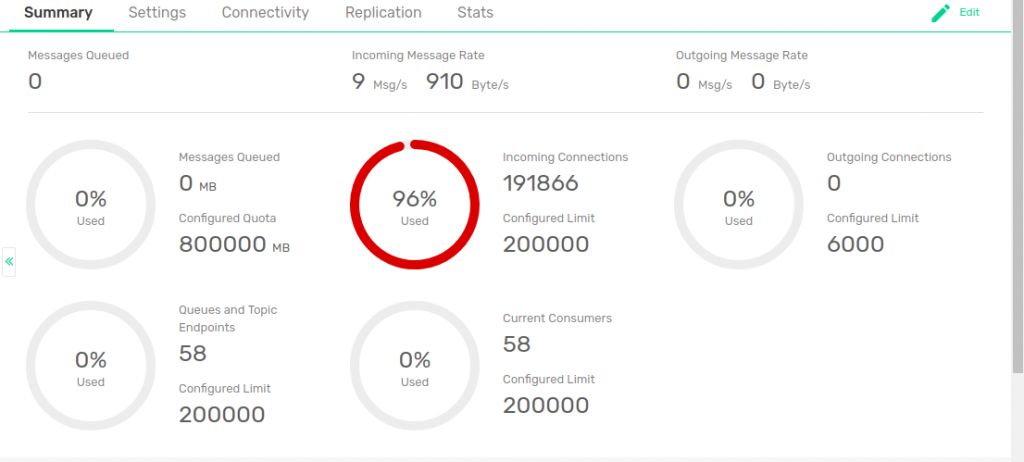
Solace software message broker CPU and memory usage by the end of the test
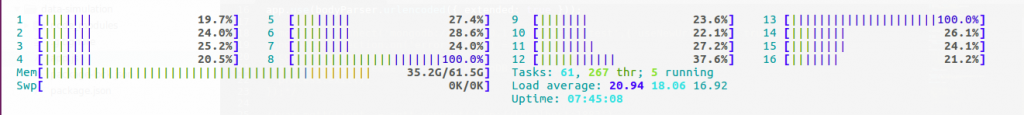
A software solace broker with nearly maxed-out connection limits
MQTT connect command to the broker captured by wireshark

Publish message format

Connection Acknowledgement

Publish Acknowledgement

b) Application server
We implemented backend part of our application in node.js. All the backend operations like analyzing data, generating results, querying the databases is implemented with node.js. As node.js runs single threaded programming we make use of clustering in node.js to make use of multi processor server to improve the performance at the application end.
c) Data Stream
In IoT application the data would be continuously generating from the devices which needs to be analyzed. Routing all the data from devices to application server and to clean and analysing them at the application server would be an overhead to node.js and we recommend it as bad practice when performance of platform is our utmost concern. We would rather stream the real time data from various devices through some streaming engines where initial cleaning and analysis of data would be carried. We worked with WSO2 siddhi and Amazon kinesis for real time data streaming. As we are clearly mentioning the platform will be very much customizable the stream processor we would be using will completely depends on user requirements.
d) Database
We are using Mongodb to store the application data like users data, devices information and any kind of static data related to our platform. Then all the real time data would be written to Aerospike. Again we can also add DynamoDb, Amazon S3 for archiving data as per the user requirements.
e) Load Balancer
We are using our load balancer to distribute the messages from connected devices to our message brokers. To achieve greater than 2 million connections (inbound and outbound) mention maxconn attribute to 2500000 and it is very much important for our devices publishing messages should to stick to the same server all the time. So we need to add sticky rule in MQTT portion. In our load balancer, sticky rules are not distributed across process memories. So, we had to add attribute nbthread to use multiple threads instead of multiple processes.

Our load balancer serving > 2 million connections
f) Clients
We have seen earlier in Tsung configuration we setup a distributed environment of clients to send data to our load balancer. This scenario is more or less similar to real world clients sending data. We maintained around 24 clients connected to Tsung controller and our load balancer which in turn helped us in dealing with many real time bottlenecks. We also tested our application by sending data in different fashions from our clients for example.. Sending all the data once, send data periodically, implementing delays between publishes all the cases the platform worked really well and we could generate desired results in all cases.

CPU and Memory usage of one of the clients by the end of the test

HIghest CPU and Memory usage of Tsung controller at any point in test
Benchmark Walkthrough
a) Identifying points of failure and bottlenecks
Out of local source ports
Initially all our infrastructure was placed in DigitalOcean. When we ran the test for 2 brokers each of 200k connection support we could see that no message broker is maintaining concurrent connections beyond 65k then after little observation on htop and googling for some time we found the reason that the TCP packets should be unique with the quadruple of (source IP, source port, destination IP, destination port). We identified the problem as “out of local source ports” since the load balancer which is client in our case has a single with 64K available ports and to each broker it could only provide us with 64K different (Source IP + Source Port) combinations.

What is an ephemeral port?
An ephemeral port is a short-lived endpoint that is created by the operating system when a program requests any available user port. The operating system selects the port number from a predefined range, typically between 32768 and 61000, and releases the port after the related TCP connection terminates.
By increasing the range of ports to 1024 and 65535 so the available ports for any application would be (65535-1024 = 64511) We can get around 64k connections with different source port from a single source IP. This is the reason we are maintaining around 64k connections from load balancer to each message broker.

Creating Virtual IP’s for clients
In AWS, first we need to create a VPC and then had to create EC2 instances for brokers and load balancer in the same VPC. Then assign private IP’s to load balancer instance which will be added its private network. After creating the private IP’s they need to be added to private network of load balancer instance. This done as:
ifconfig ens5:1 <private IP1>
ifconfig ens5:2 <private IP2>
Continue to add as many private IP’s that are to be used as source IP’s in our load balancer.
For more than one million connections we have assigned about 24 (24*64000 = 1536000 combinations of source IP and ports) virtual private IP’s to network and made them as source to each message broker by adding source attribute to server in load balancer configuration file. We need to add the source of messages to each broker in config file as shown below:
server broker_1 <IP of broker 1>:1883 source 10.0.0.1
server broker_2 <IP of broker 1>:1883 source 10.0.0.2
server broker_3 <IP of broker 2>:1883 source 10.0.0.3
server broker_4 <IP of broker 2>:1883 source 10.0.0.4
Likewise we made a configuration file with 24 source IP’s and 6 message brokers. We then run the test then we could see our port exhaustion problem is solved everything seems to be working well. But in between the test we had seen that the connections are getting either dropped or not accepting the connections from client. Then after googling a bit we got that AWS ec2 instances is having certain TCP connections limit.
TCP connections limit in AWS EC2 instances
Initially our load balancer is in t3.2xlarge where we can see only around 240k concurrent connections.
But we need more than 2 million connections(inbound and outbound) to say more than one million connections to brokers. So after some trails with m5.4xlarge, c5.4xlarge, c4.8xlarge we could reach around 1.4 million connections approximately.

After crossing 700k concurrent users(only inbound connections to load balancer) i.e after reaching around 1.4 million connections, the TCP connections started dropping. This is the case with m5.4xlarge and c5.4xlarge and c4.8xlarge. AWS artificially limits the number of concurrent TCP connections from any EC2 instance, and this limit grows as you scale up the server price table.
Then we opted for an EC2 instance with a higher throughput to reach our limit. It worked perfectly well and we could get the expected results.
b) Simulating the real world scenario
Even all our clients are small in number we still tried to consider possible real time scenarios that we could do. We tested the clients send data in different real world cases:
- In real world there will be a case when the devices would connect to platform and publish the data immediately after they connect without any delays in them. So have also performed similar use case by configuring the tsung.xml file in such a way that all the clients publish data immediately after they get connected and to see simultaneous connections we kept them connected even after data publishing is finished.
- We also simulated cases where there will be situations all the publishes can’t happen in one go immediately after client connection. So we added some delay between each publish and attempted to maintain the connection to the platform and client even in that periodical delays between client publishes.
- There may be a state the device just want to connect and maintain its connectivity at some point it may have data to be published. We replicated this case as well by just first connecting the clients and them made them to sleep for some time after connection and then made them to publish the data to the brokers.
- Usually people may think that we have taken all or Tsung clients in same geographic location. But this is not the case with the real world situation. In real time we may get clients from different geographic locations. So to replicate this case we move further and have taken all our servers for running our Tsung clients in different geographic location.
We have seen some possible real world test cases and have simulated the cases as mentioned above. In all the cases we have achieved nearly similar kind of results.
c) Linux – TCP/IP walkthrough – Challenges involved
It is very much important to make the TCP/IP settings properly and make them maximum enough that all the clients and load balancer can open huge number of file descriptors simultaneously. So we made sure that clients and load balancer’s open files, ulimit and other TCP settings to be increased. Furthermore some TCP settings are changed to get proper test results.
Changes we made with TCP/IP settings:
In /etc/sysctl.conf
fs.file-max denotes the maximum number of open files on a Linux system.The maximum file handles that can be allocated
fs.file-max = 10000000
fs.nr_open = 10000000
The tcp_mem variable defines how the TCP stack should behave when it comes to memory usage.The first value specified in the tcp_mem variable tells the kernel the low threshold. Below this point, the TCP stack do not bother at all about putting any pressure on the memory usage by different TCP sockets. The second value tells the kernel at which point to start pressuring memory usage down.The final value tells the kernel how many memory pages it may use maximally. If this value is reached, TCP streams and packets start getting dropped until we reach a lower memory usage again. This value includes all TCP sockets currently in use
net.ipv4.tcp_mem=10000000 10000000 10000000
tcp_rmem variable takes 3 different values tells the kernel the receive buffer for each TCP connection, and this buffer allocated to a TCP socket
net.ipv4.tcp_rmem=4096 65535 1000000
tcp_wmem variable takes 3 different values which holds information on how much TCP sendbuffer memory space each TCP socket has to use.
net.ipv4.tcp_wmem=4096 65535 1000000
rmem_max sets the max OS receive buffer size for all types of connections.
net.core.rmem_max=1000000
wmem_max sets the max OS send buffer size for all types of connections.
net.core.wmem_max=1000000
tcp_max_syn_backlog increase the number of outstanding syn requests allowed.It MUST NOT be used to help highly loaded servers to stand against legal connection rate.
If we see synflood warnings in logs, and investigation shows that they occur because of overload with legal connections, we should should tune netdev_max_backlog variable until this warning disappear.
net.ipv4.tcp_max_syn_backlog = 65535
net.core.netdev_max_backlog = 65535
ip_local_port_range that defines the minimum and maximum port a networking connection can use as its source (local) port. This applies to both TCP and UDP connections.
net.ipv4.ip_local_port_range=1024 65535
Ipv4.tcp_tw_reuse variable says that TCP connection can be reused immediately without going into state of TIME_WAIT.
net.ipv4.tcp_tw_reuse=1
In /etc/security/limits.conf:
To increase the ulimit value one should first increase the limit of open files as shown above and then set the soft and hard limits for root and non-root users as shown below.
* soft nofile 10000000
* hard nofile 10000000
root soft nofile 10000000
root hard nofile 10000000
After setting them restart the nodes the default values will be increased.
d) Cloud Providers – Challenges involved
DigitalOcean
Initially we worked with DigitalOcean then we came across the out of source ports. Since Each TCP packet should have its own unique TCP tuple identifying it.
A TCP tuple consists of
- Source Port
- Source IP Address
- Destination Port
- Destination IP Address
When packets are sending from load balancer to message brokers, each broker could only get 65k different destination ports as we couldn’t change the source IP i.e., out of source ports. So we need to introduce the virtual IP’s in client side so that we could generate TCP tuple with different source IP address. We need to create Virtual IP’s that could give us more number of (Source IP + Source Port) combinations. But to get virtual IP’s configured with the load balancer. We need private IP’s in same Network of the load balancer and message brokers. This is possible only by creating with VPC. And DigitalOcean doesn’t support creating VPC.
AWS
AWS support with creating VPC and launching EC2 instances for message brokers and our load balancer and it also generated private IP’s to our load balancer and change the source IP for each TCP packet. But AWS comes up with its own challenge of limiting number of TCP connections. This problem is solved by implementing trial and error method of trying out some EC2 instances to get the correct one.
e) Outcome
After identifying all the bottlenecks with different components every time we worked to solve the issues in utmost efficient way to make sure that there will not be any point of failure in near future. And we put together all the components and solutions for each challenge we found and we could finally see the greater than million simultaneously connected devices sending data to our brokers. And the results are:
Maximum values of each attribute in final test:

Network Throughput:

Simultaneous users connected to platform:

The messages count in each message broker that can sum up to greater than one million:

How this impacts your business?
The high scalable and robust platform would help you majorly concentrate on the business enhancements rather than the technical stuff. Also when you have huge customer acquisitions and very large scale industries you should never bother about the simultaneous device connections, connectivity or data loss. ThingSphere is very much reliable and ensures of no data loss even when connectivity is lost or broker failover. So that you will get accurate analysis which would collectively helps your business grow.
Summary
Breaching 1mn concurrent active connections was merely a first step in an ocean of possibilities. We love solving difficult-to-scale IoT challenges at ThingSphere – and have taken multiple strides towards a seamless connected future for an infinite cloud of connected devices. The next up on our scaling series shall brief about our challenges and solutions to write >1mn data samples to our database. Stay tuned for updates!